Selecting benchmarks for target date funds (TDFs) has long been a challenge. Most TDF providers build a custom benchmark for performance comparisons. While this approach is useful in measuring two key variables in TDF performance—manager selection and tactical positioning—it does not capture differences in glidepath design and asset allocation that are the major drivers of relative performance across the TDF peer universe.
To address this issue, Callan pioneered the creation of TDF benchmarks that seek to identify a “consensus” glidepath design for the entire TDF universe so that the asset allocation effect can be captured in manager returns relative to this consensus benchmark. S&P institutionalized this concept with the creation in 2008 of the S&P Target Date Index series, which provides the TDF industry an objective third-party benchmark and which has been adopted by a number of major TDF providers.
However, when reviewing the index construction methodology used by S&P Dow Jones Indices, an interesting fact emerges: S&P (understandably) uses S&P indices for all underlying asset class exposures even when a different “industry standard” index exists, as illustrated in the table below. In looking at performance over the past 12 months, this use of S&P indices has had an outsized impact on results.
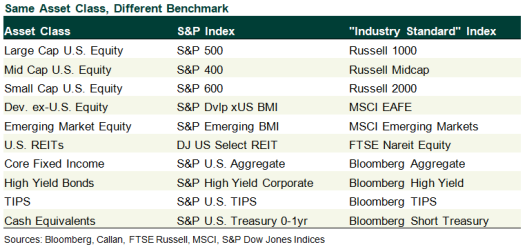
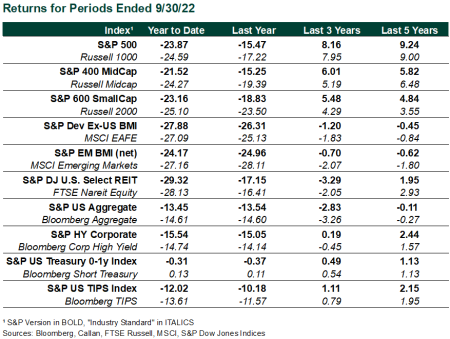
For example, measuring the major asset classes of U.S. equities and fixed income over the past 12 months, the S&P 500 has outperformed the Russell 1000 by 175 basis points, and the S&P U.S. Aggregate Bond Index topped the Bloomberg US Aggregate Bond Index by 106 bps. Even more starkly, the S&P BME Emerging Markets Index crushed the MSCI Emerging Markets Index by 315 bps. The table below shows the performance of the S&P TD Index asset class constituent indices compared to the industry standard indices.
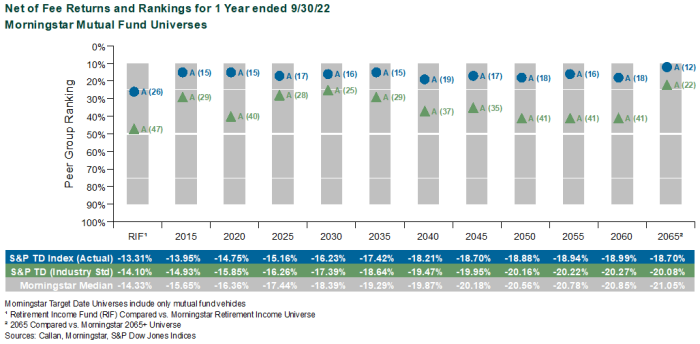
Over the past 12 months, these nuances in index selection within the S&P TD Index series have led to significant performance dispersion relative to the universe of TDF products. Over that time period, the consensus-based S&P TD Index series ranks in the top quartile of the universe of TDFs across most vintages. The magnitude of performance difference from the median observation in the Morningstar TDF peer universe ranges from 102 basis points (retirement income vintage) to 235 basis points (2065 vintage).
A Different Approach to Evaluating TDF Benchmarks
In order to isolate the impact of this “index selection bias” on the overall S&P TD Index series, we recast the S&P TD Indices using the industry-standard asset class indices with the same asset allocation exposures and rebalancing periodicity. On average across 12 vintages (2015-2065 plus Retirement Income) the impact of index selection was 117 basis points over the 12 months ended Sept. 30, 2022. This index selection impact represented as much as 25 percentile points in the 2055 vintage (16th percentile for the actual S&P TD 2055 index vs. 41st percentile for the recast version). Complete details on the impact of index selection on returns and peer rankings can be found in the chart below.
Performance of the target date fund universe over the past 12 months has not been very attractive when compared to the S&P TD Index series. Some of that underperformance can be explained by the asset class index selection methodology within the index series. When comparing TDF series’ performance to the S&P glidepath expressed in industry standard indices, a meaningful amount of the universe underperformance is explained by index selection effect. However, there are clearly other elements at play. Active manager underperformance in developed ex-U.S. equity and core/core plus fixed income are likely factors. Tactical asset allocation is also a probable headwind for the universe.
Callan continues to believe that a weighted index series using a universe consensus glidepath is a good yardstick against which to measure TDF performance. Combined with custom glidepath weighted benchmarks and peer group comparisons, plan sponsors can assess the various factors that impact TDF performance on both an absolute and relative basis.
Disclosures
The Callan Institute (the “Institute”) is, and will be, the sole owner and copyright holder of all material prepared or developed by the Institute. No party has the right to reproduce, revise, resell, disseminate externally, disseminate to any affiliate firms, or post on internal websites any part of any material prepared or developed by the Institute, without the Institute’s permission. Institute clients only have the right to utilize such material internally in their business.